Now that you have entered data into your apps, wouldn’t it be nice to have a way to visualize it? With the built-in expression and visualization tools in Appanzee, you can!
Expressions are the same idea as functions in a spreadsheet, and a visualization is a way for you to see the result in a chart or figure.
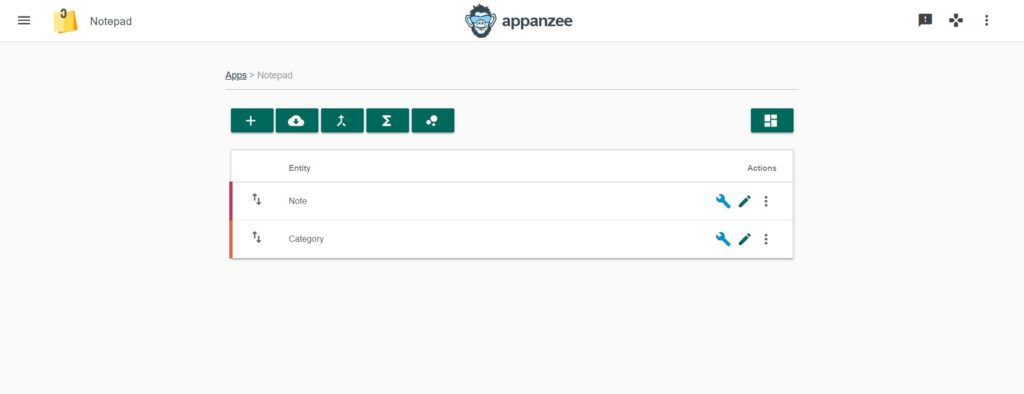
For this example, we’re going to use the Notepad App. The App has 2 entities: “Note” and “Category”.
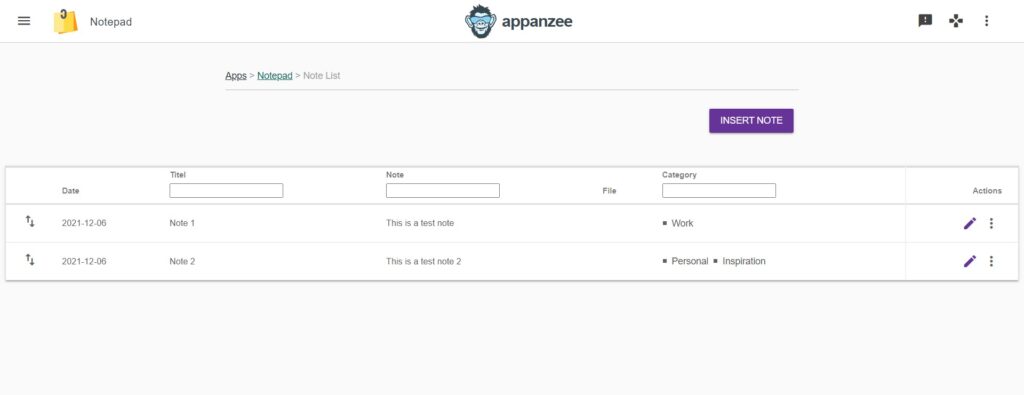
In the note tab, we have 2 test notes that are in 3 different categories.
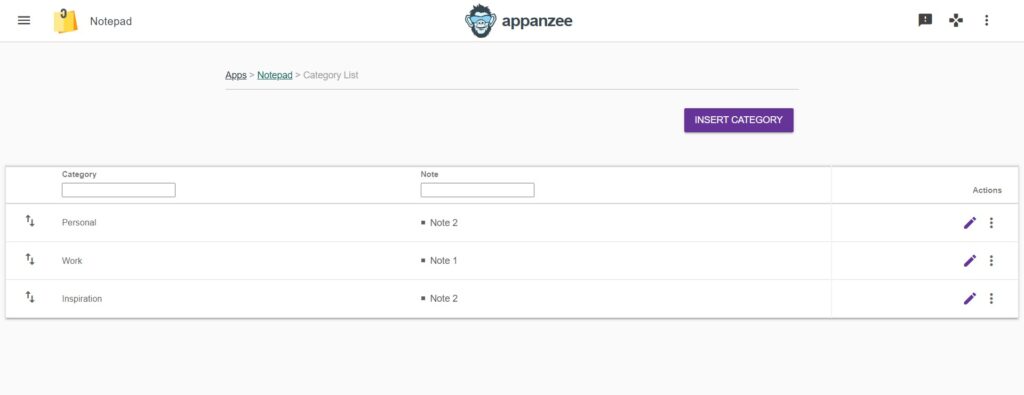
In the category tab, we have 3 different categories.
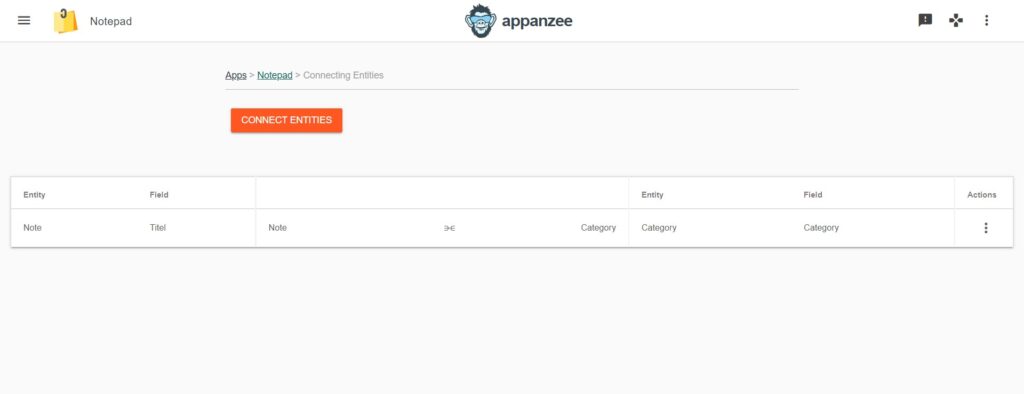
These entities are connected.
Expressions
Let’s say we want an expression to count all the notes written. When you go into Expressions and press Create, you can see 3 tabs:
- Terminology: The different functions you can use when writing DAX Expressions
- Entities/Fields: Every tab and field has an ID number
- Relations: Every connection also has an ID number
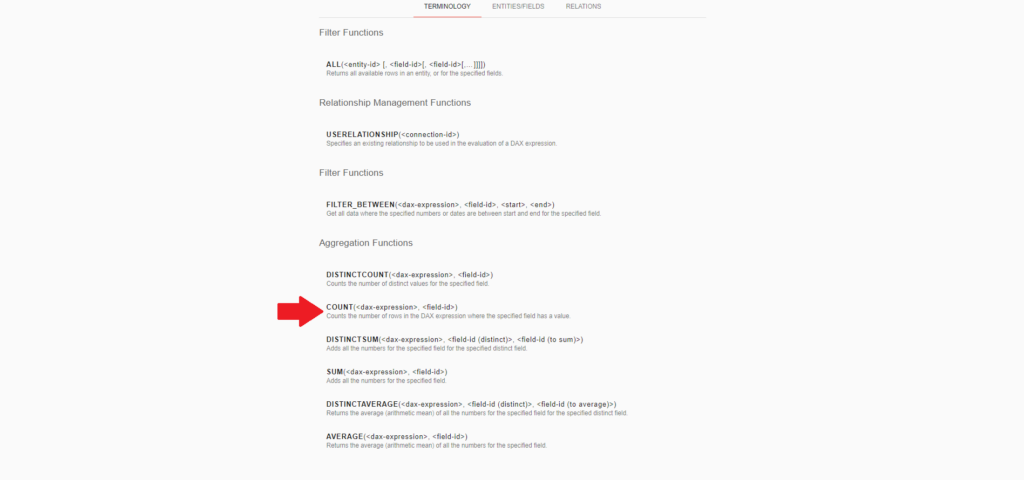
We start by choosing the right functions, in this case it’s “COUNT” since we want to count something and “ALL” since we want to count everything in that tab.
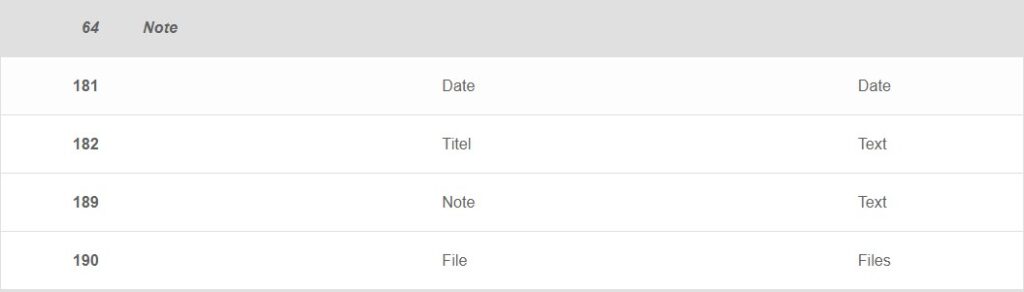
The next step is to get the right IDs for the fields. By looking at the entities/fields, we can see that ID 64 is for the Notes App.
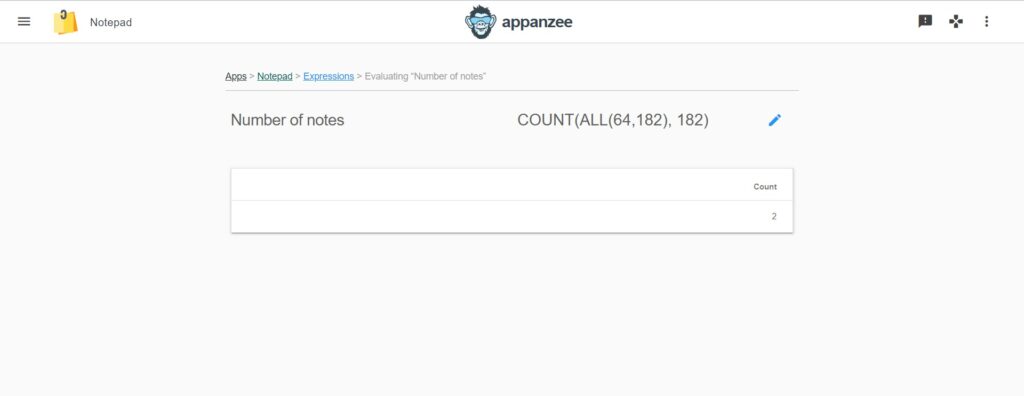
Since all the notes in this app require a title, we can use Field ID 182 to count on, but you could also use Date or even Note. This gives you the expression: COUNT(ALL(64,182), 182). That’s because we want to see ALL of the rows related to field 182 (Title) of tab 64 (Notes), and COUNT on that same field.
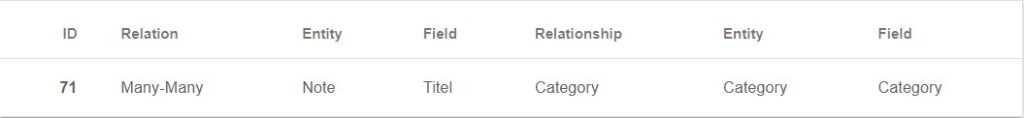
What about an expression to see how many notes you have in each category? This is where the Relations tab becomes interesting.
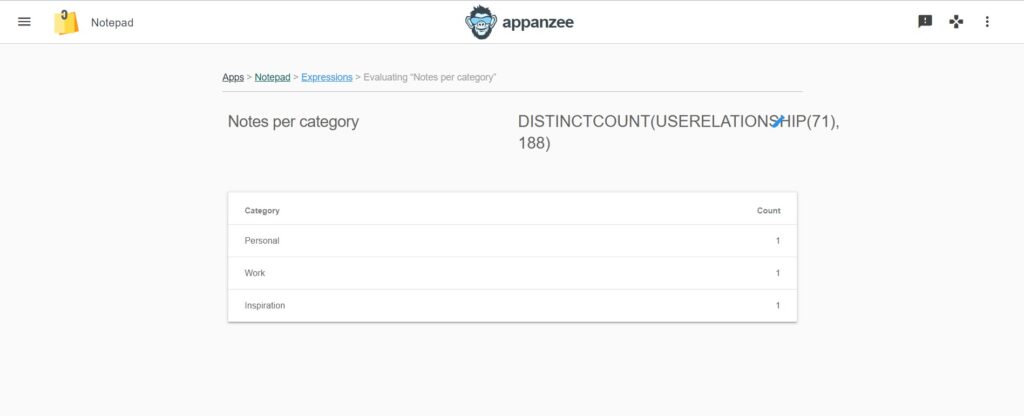
Again, we start by selecting the appropriate functions. We need “DISTINCTCOUNT” and “USERELATIONSHIP” since we want to count distinct values based on a connection, in this case we want to count the number of notes, according to the category field. Now we need the right IDs. First, the ID again for Title which is (64,182) and secondly the ID for the connection which is 71. By adding the function with the IDs, you get the expression: DISTINCTCOUNT(USERELATIONSHIP(71), 188).
Visualizations
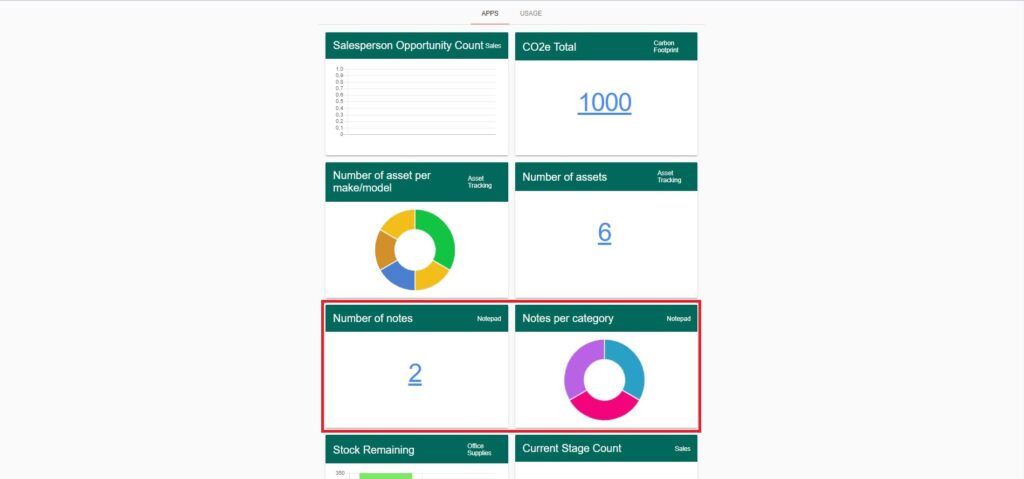
Now that we have our expressions set up, how about we turn the numbers into some visualizations? Simple! Just go the visualizations tab, press create visualization, choose the expression you want to visualize, how you want to see it and you can choose to pin it to the main dashboard!
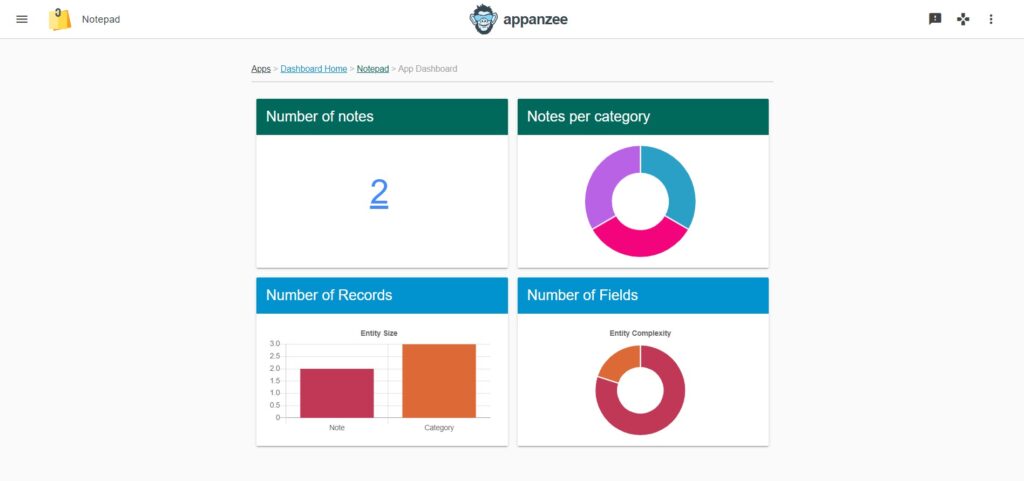
Beautiful right? Just press the “View App Dashboard button” and you can see the number of records you have in the app, as well as your visualizations!